GHHF vs Self-Leverage

GHHF has now been available for over a year, providing us with an opportunity to compare its real-world performance against a hypothetical self-leveraged portfolio. While both aim to boost returns through debt, there are critical differences in rebalancing, currency exposure, fees, and tax implications that can sway the outcome.
The motivation is GHHF has access to cheaper debt than most can get via there mortgage, so is it worth moving over to it? Or do the other costs decay its lead?
The idea is to compare GHHF to self-leverage, that is buying the same assets with the same amount of debt where the debt is obtained via debt recycling or an equity release.
Disclaimer: I'm no expert at doing these comparisons, so take everything with a grain of salt.
TLDR
GHHF and self-leverage have delivered remarkably comparable returns over the past year of 17.6% pa vs 17.7% pa.
Differences
Rebalancing
A key differences is self-leveraged will not rebalance. Perhaps later I'll rebalance yearly.
Rebalancing has both positive and negative impacts, so it will be interesting to see which way the last year goes. In a sideways market rebalancing can negatively impact GHHF, while in an rising market it can benefit GHHF.
Currency Hedging
I believe GHHF has additional currency hedging beyond using HGBL. I have not accounted for this.
Fees
GHHF fees are 0.35% inclusive of the fees in the underlying assets. The underlying fees are combined 0.07%, so the additional fee of GHHF is 0.28%.
Interest
It is speculated that the internal interest rate is the cash rate + 1%, so about = 4.25% + 1% = 5.25% over this period
Meanwhile, P&I mortgages over the same period are around 6.16%, thus GHHF has an edge for its cheaper debt.
GHHF is effectively interest only, while self-leveraged will be Principal and Interest in this comparison.
Expected GHHF Cost
To estimate the cost we can add the fee and interest rate together.
However the 0.28% is of the full asset value. As this is the fee we pay to access the debt, we need to convert it to of the debt amount to be usable in estimating the interest + extra fee amount. The leverage amount from below is 1.53.
Debt Fee
= 0.28% x 1.53 / .53 = 0.81%
Expected GHHF Cost
= 5.25% + 0.81% = 6.06%.
Method
- Use waybackmachine.com to find the earliest possible gearing ratio and allocations.
- Purchase $100,000 of GHHF on Sharesight
- Purchase the equivalent underlying assets in Sharesight using the same amount of debt from the mortgage.
- Compare the difference in return against the amount borrowed
Research

- 22/MAY/2024
- Gearing Ratio: 33.9%
- 30/APR/2024
- Australian Equities: 35.0%
- US Equities: 42.4%
- Developed Markets - Ex US 16.0%
- Emerging Markets: 6.6%
- A200: 35.0%
- BGBL: 37.4%
- HGBL: 21.0%
- IEMG: 6.6%
Sharesight
- GHHF 3796 units @ $26.35 = $99,998.25
- A200 403 units @ 131.41 = $52,958.23
- BGBL 888 units @ $63.73 = 56,592.24
- HGBL 507 units @ $62.63 = $31,753.41
- IEMB 122 units @ $54.24 USD = $9,999.72 AUD
Results
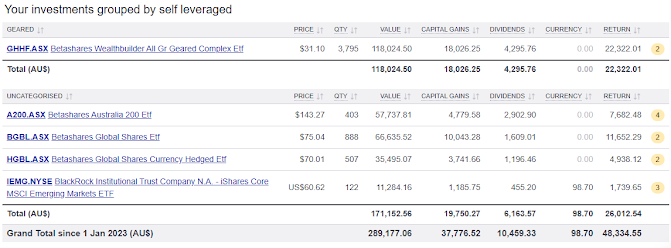
- Self-leverage: $22,472 or 17.7%
- Market = $26,102 (excluding debt cost)
- Debt = $51,285 x 6.16% x 1.12 years = $3,540
- Total = Return - Debt = $26,012 - $3,540 = $22,472
- Return % = (1 + 22,472 / 100,000 / 1.12 years) ^ (1 / 1.12) - 1 = 17.7%
- GHHF: $22,322 or 17.6%
- Market = 22,322
- Return % = (1 + 22,322 / 1.12) ^ (1 / 1.12) - 1 = 17.6%
GHHF Comparison Rate = (26,012 - 22,322) / 51,285 / 1.12 years = 6.42%
Annualising Interest Rates
Tax Deductibility
MTR = Marginal Tax Rate
After Tax Return = Dividend x (1 - MTR) - Interest x (1 - MTR) = (Dividend - Interest) x (1 - MTR)
- Claim the dividends and interest separately
- Claim the dividends minus interest

Comments
Post a Comment